.svg)
.jpeg)
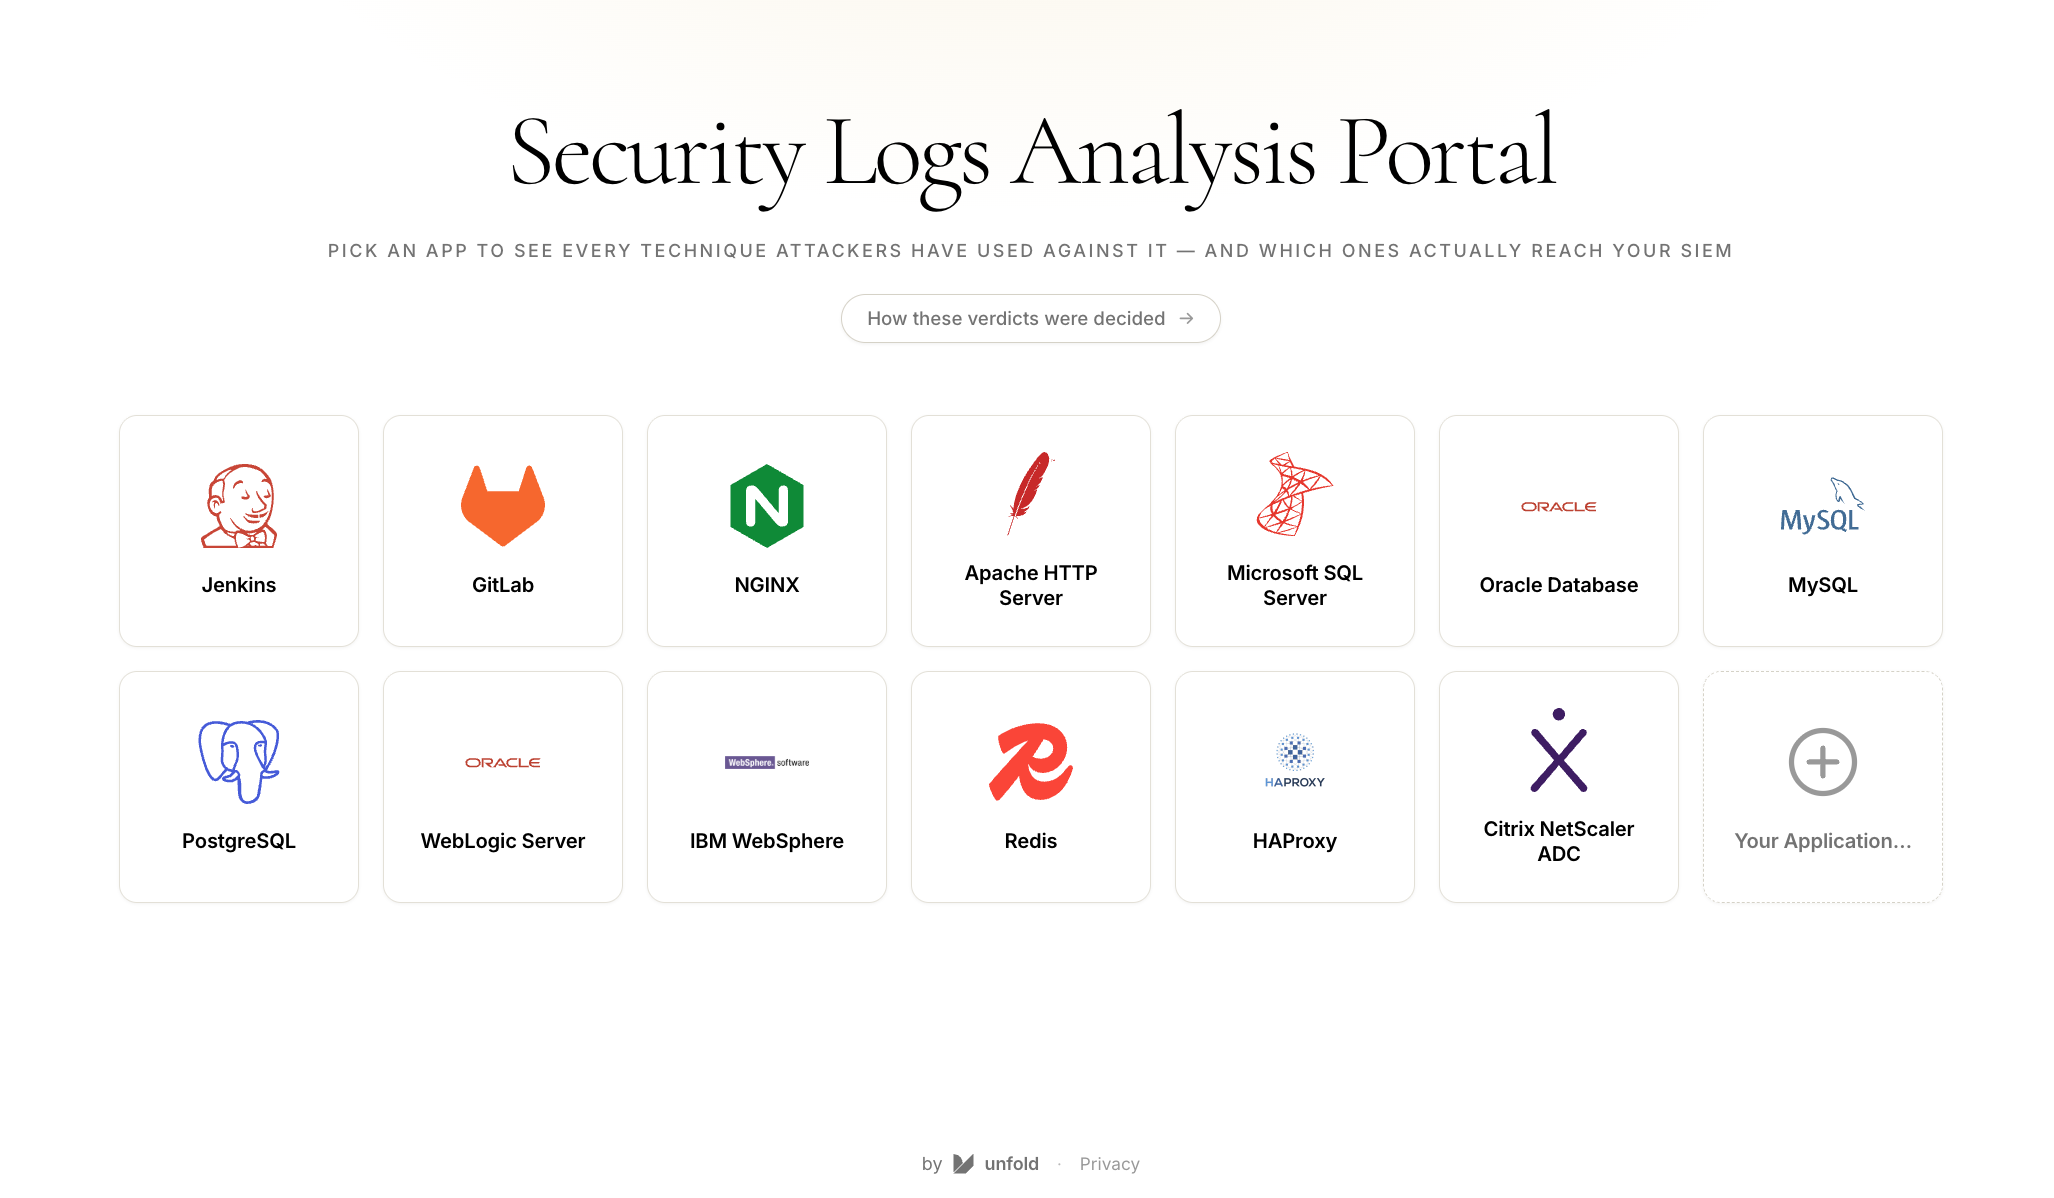
We are publishing a public portal aimed at giving defenders a clear picture of what techniques can be logged and detected in server applications. We aim to help teams understand what they can and cannot know from their logs, and detail here our journey that led us to create the portal.
A few months ago we started building an AI workflow for detection engineering. Detections are built on logs, so it starts with what's actually connected and in the data lake.
We pointed it at Jenkins, the CI/CD server that holds the credentials to most of what our company deploys. After some detections were created, we wanted to ascertain that they actually cover the basic scenarios we thought about: If someone dumps every credential stored in Jenkins, would we see it? We tried and at best, we would see that a script ran, its code, the account that ran it, the timestamp. What we would not see is what it returned. The passwords go back to the attacker's browser and never touch a log line.
Then, we tried to see what happens if we tamper with a build and make it run an edited command. Some stages produced logs like creation and start of build, but no build change, and most importantly not what actually changed and by whom.
Both times the log tells us an action happened and withholds the one detail we can act on. We can prove a pipeline was tampered with, but we can't see what was put in it.
Jenkins ships an audit trail plugin, and we had it installed and configured before testing. You would expect this to be the easy case. But of the 36 ATT&CK techniques we eventually assessed against it, only one is logged explicitly - telling us if a malicious plugin is installed. That's the whole list.
To work out which techniques you can actually search for, there are two places you'd normally look: the vendor's documentation, and your own data lake. Both tell you what's there. Neither tells you what isn't.
Vendor documentation gives you a menu of what a product logs; it never provides a list of its blind spots. Our own data lake has the same problem, it shows us what arrived, never what should have arrived and didn't. We can watch a Jenkins audit trail for a week and never notice the credential dump is missing, because there is nothing there to notice.
Absence doesn't announce itself. The only way to establish it is to perform the action and watch for the log that never appears.
We decided to test the applications against real-world scenarios, actual technique execution, and watch their logs. Thirteen server applications deployed the way they ship, each wired to its documented Splunk or Microsoft Sentinel integration. One question per technique: if an attacker did this, would anything in your logs show it?
Three rules kept us honest:
356 assessments, scored with MITRE ATT&CK and cross-referenced with 71 campaigns from the wild.
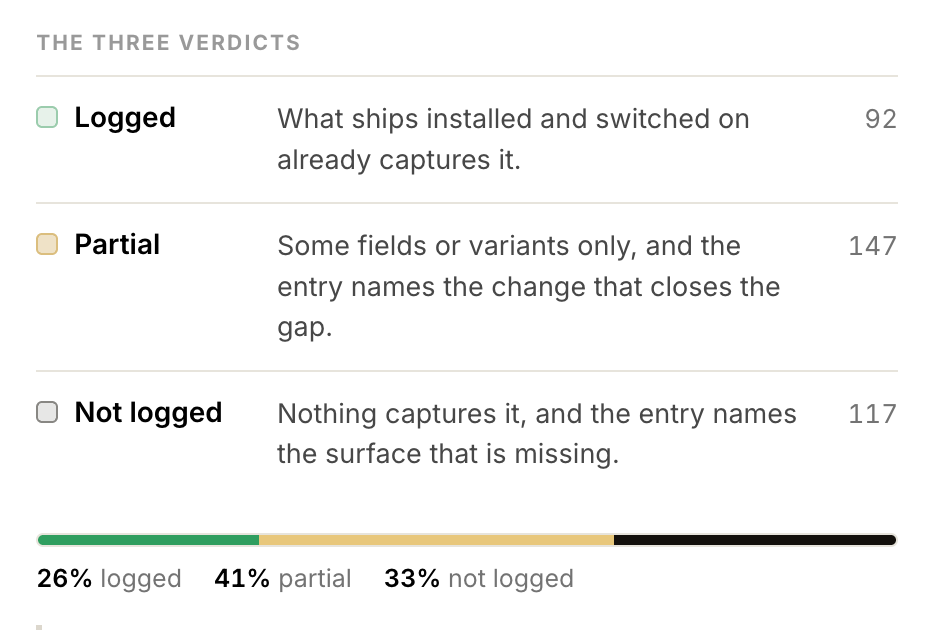
Roughly three-quarters of what we assessed isn't fully visible in a stock deployment. A third leaves no usable traces at all. Many of the techniques we assess have no record of being used in the wild against the application, but clearly can be. With time, applications only get more and more capabilities and features, opening new windows for attackers, which nobody catalogued.
Citrix NetScaler ADC is one of the better-logged systems we tested: 25 of 44 techniques captured out of the box, every management command recorded with user and source IP.
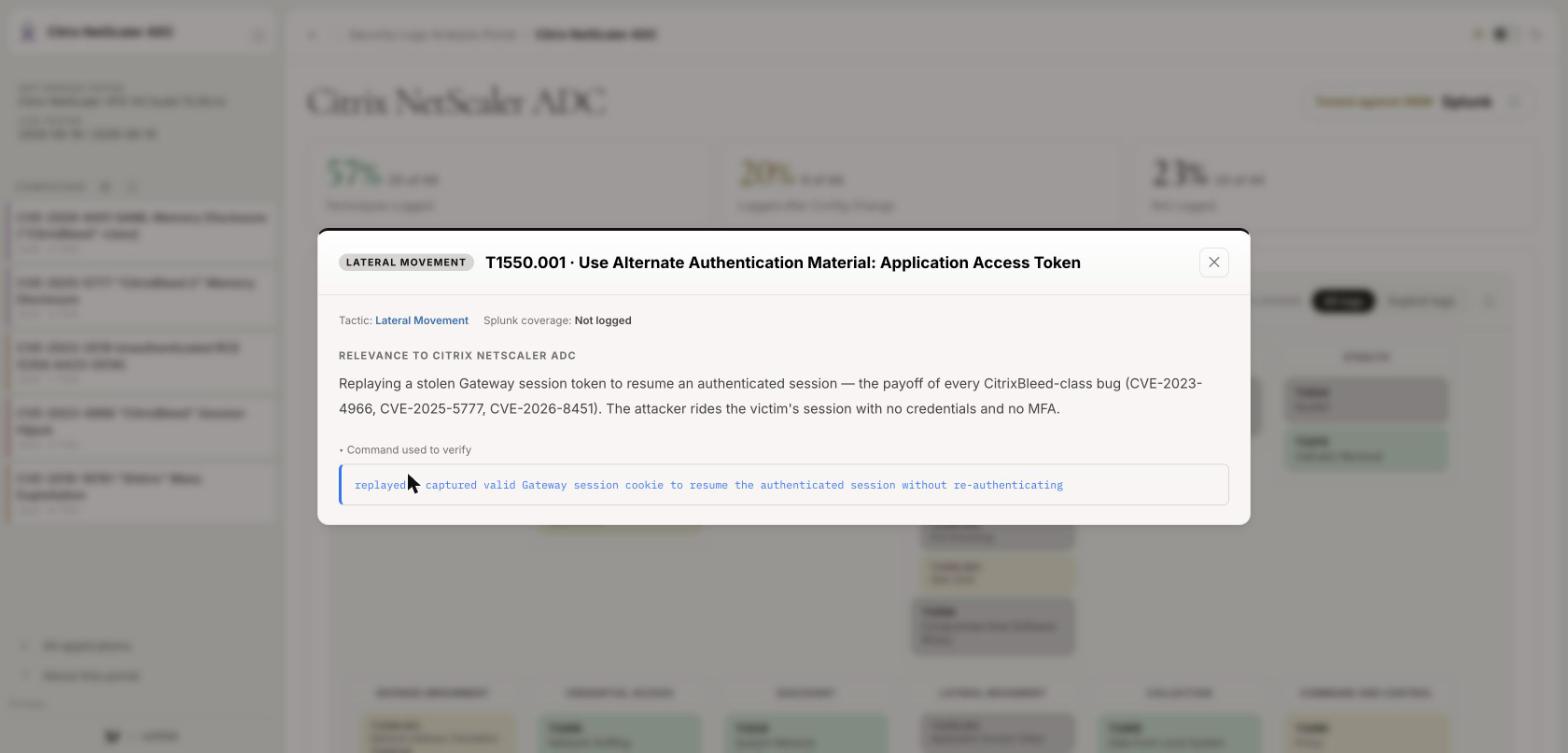
Now trace CVE-2023-4966, CitrixBleed, across it. The attacker leaks a chunk of appliance memory, finds a valid session token in it, and replays that token to resume an authenticated session, no password and no MFA prompt.
That last step produces nothing. No login event, because there is no login: the appliance treats the attacker as the legitimate user still browsing. And no configuration change fixes it, because there is no setting that creates the event.
As patching is often done after exploitation, CitrixBleed was, and CitrixBleed 2 and 3 (released recently), continue to be undetectable by normal Citrix logs. No clear log for the Application Access Token technique exists, and logs for webshell-related activity are hard to get.
Most rules we get for our SIEM were written for some abstract scenario, assuming logs come from very specific sources, based on rules that aim to be generic for multiple applications, or just vendor packs that on the surface detect everything. But when one filters on a field your deployment never populates, it returns zero results forever, and zero results reads as clean.
The rules you do write have a subtler version of the same problem, because detection effort follows the telemetry. The one Jenkins technique that logs cleanly out of the box is plugin installation, so that's where the content goes. A team ends up with a genuinely good set of rules for malicious plugins, and nothing for the credential dump or the poisoned build we opened with. Not because nobody thought of them. Because there was nothing to write against. The library ends up shaped like the telemetry instead of the threat, and from the inside that looks like a mature Jenkins practice.
Our own numbers have the same problem. The verdicts above are the generous reading: they count evidence you could reconstruct by correlating across events, not only logs that name the technique outright. Every board re-grades on demand: switch it to explicit evidence only and Citrix drops from 25 techniques logged to 1. Jenkins drops to none. That correlatable evidence is real, but with no detection content written against it, the log never told anyone anything.
Point an AI triage layer at the same data lake and it reaches the same conclusion faster, and with more confidence, because it has no way to see the gap either.
Every one of the 147 partials names the change that closes it - a config setting, a plugin, a license tier, or SIEM-side collection.
But these fixes come with some cost. Adding one endpoint to an audit plugin's URL-pattern regex costs a minute; full web logging on a NetScaler fronting production can multiply the ingest bill and the false-positive rate. Exactly where something is too noisy to switch on but too exposed to leave off, there's a need to build a tailored ingestion for it. That's why the fixes are on the board at all: not as advice to turn everything on, but so you can price the trade.
The 117 unlogged techniques require a different conversation. In those techniques there is no log to turn on. Not a setting that's off, no surface at all. The NetScaler session token replayed with no login behind it. The Jenkins credentials that only ever reached a browser. For those the honest answer is no, and no amount of tuning changes it.
We put the portal up so a defender can see what's realistically detectable on a system before an incident forces the question, and can decide where a gap is worth closing: by configuration, by building the collection yourself, or not at all.
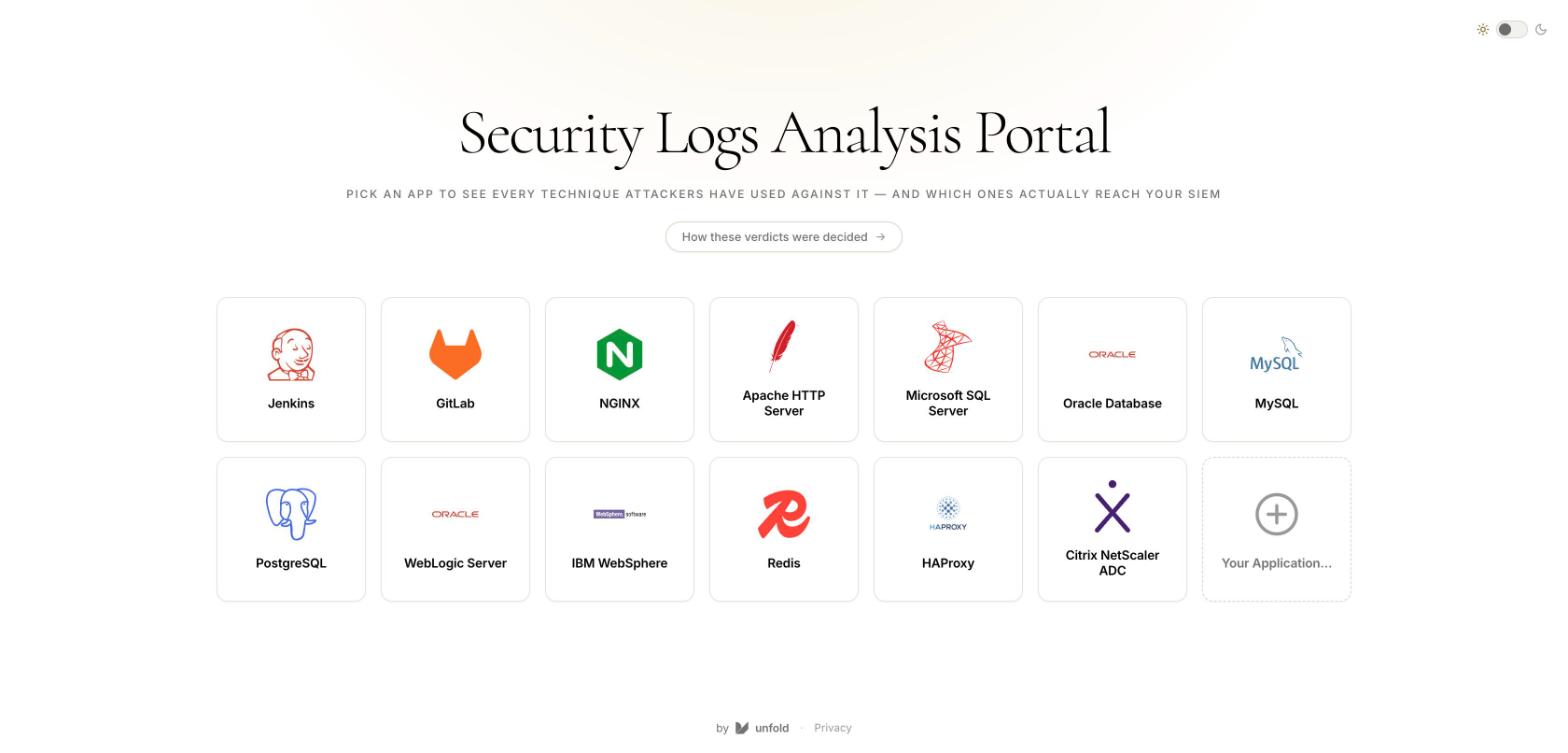
It's live and accessible to all at portal.unfold.ai - one board per application, one cell per technique. Click a cell for the verdict, the log line(s) holding the evidence, the change that closes the gap, and a real sample of the output. Pull up whatever you run and check our verdict against your own data lake; possible fixes are written to be pasted into a ticket. If what you run isn't one of the thirteen, reach out to us in the form.

We plan on releasing a more in-depth version of the portal enumerating the various actions that can trigger each technique and their corresponding logs, giving practitioners a more nuanced understanding.
We never did finish the detection workflow we started. It turned out we were automating the wrong half of the problem: the writing was never the bottleneck, the evidence was. Any AI layer you point at your logs inherits its limitations, silently, at machine speed and with machine confidence. The data has to be there first.
You can run the small version of this yourself this afternoon: pick a rule you trust and check that the field it filters on is actually populated for the system it covers.
Tell us what you find and how you handle those blindspots: contact@unfold.ai.